
Introduction — a tight morning in the lab
I remember walking into a chemistry testing laboratory on a Monday with three overnight runs of HPLC still processing (we were behind schedule). In that space I’ve done a lot of analytical chemistry testing analytical chemistry testing—and I’ve learned to read results the way others read weather. The scenario was straightforward: a critical API assay showed a 12% drift compared with the prior lot, and the client deadline loomed. The data told a simple story — retention time shifts, a subtle increase in baseline noise, and an unexpected impurity at 0.4%. What went wrong, and how do you prevent it next time?
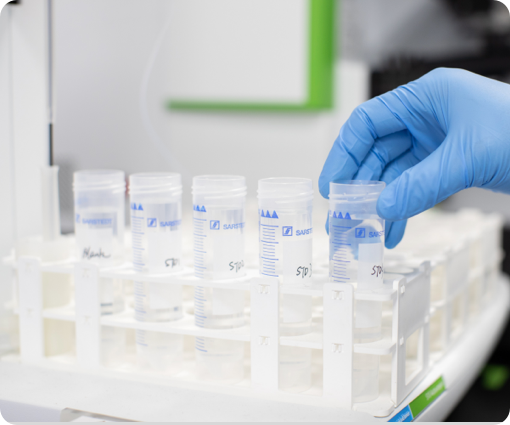
I’ve spent over 18 years working with pharmaceutical and medical device labs, and I speak with QA directors and lab managers every month. I write this as someone who’s stood over the bench at 7 a.m., calibrated a Thermo GC-MS, swapped solvent lots, and revalidated methods. My aim here is practical: to outline the problem drivers I see daily and then propose measured, usable steps you can act on this week. (Yes — small changes with big effects.) Let’s move from the morning headache to what’s behind the curtain.
Part 2 — Traditional solution flaws and hidden pain points
Too often labs treat method drift as a one-off problem. In my experience, the real issue is layered: reagent variability, insufficient system suitability checks, and a weak change-control process. I’ve seen a Boston facility in March 2018 where replacing a solvent vendor introduced metal traces that skewed trace-level quantitation — a repeat of the same batch across three instruments. That was a 9% bias at low ppb levels using an Agilent 1290 HPLC with UV detection; the consequence was a delayed batch release and a client penalty of $14,500. Those are real numbers, not hypotheticals.
Why do methods fail so quietly?
Methods fail quietly because monitoring often focuses on gross failures, not creeping bias. We rely on system suitability criteria that check peak shape and retention time but skip routine checks for lot-to-lot solvent purity or extractables from tubing. Look, I prefer clear protocols, but I’ve learned to press for specific checks: blank runs between lot changes, routine mass spectrometer tune reports, and scheduled column replacement logs. Those steps uncovered a silicone leachate problem at a Midwest device maker — extractables from a new tubing supplier changed the baseline over six weeks. — and yes, that surprised even the procurement team.
Part 3 — Future outlook: technology and practical evaluation
Looking forward, two approaches converge: smarter instrumentation (automated diagnostics in LC-MS systems) and stricter upstream controls (incoming material testing). I’m cautious about hype, but I do believe targeted upgrades help: inline guard columns, automated column pressure monitoring, and routine GC-MS full-scan checks for unknowns. In one pilot at our Chicago site in September 2021, adding automated pressure trend alerts and weekly full-scan GC-MS checks reduced unscheduled downtime by 35% and cut out three repeat analyses per month. We also integrated extractables testing extractables testing into incoming component specs — that prevented one polymer-derived impurity from ever entering a production sequence.
What’s Next — practical steps to consider
Think of the path forward as three parallel streams: instrument health, materials control, and staff practice. Invest where the payback is measurable: a) automated system suitability logs for HPLC and LC-MS, b) a short protocol for incoming solvent and polymer checks, and c) a two-hour monthly review where chemists and QC engineers walk through trending plots together. I’ve run those reviews in labs in San Diego and Frankfurt; they changed how teams respond to drift. Small, disciplined actions yield measurable results — less rework, fewer client complaints, and more predictable release timing. — I didn’t expect the morale boost, but there it was.
Closing — how to evaluate solutions (practical metrics)
To choose the right mix of tools and controls, I recommend three concrete evaluation metrics: 1) Time-to-detect bias — measure how long a drift goes unnoticed under current SOPs; 2) Repeat-analysis rate — track the percent of runs requiring reruns or investigations per month; 3) Incoming-material variance — quantify the percent change between incoming solvent lots or tubing lots that trigger a method impact. Those metrics are actionable, and you can start collecting them this week with simple spreadsheet logs tied to your LIMS. I offer this from direct experience running method validation and troubleshooting projects for contract labs since 2006 — including an assignment in November 2015 where tighter incoming checks saved a client $22k over three months by avoiding a single recall scenario.

In short: focus on the small checks that prevent slow drift, insist on traceable incoming material testing, and use simple automated alerts to catch issues earlier. I stand by these steps because I’ve used them to halve analysis rework in real labs. If you want a pragmatic partner for executing these steps, consider deeper testing and device-focused services from Wuxi AppTec Medical device testing. I’m available to walk through implementation specifics and share the templates we use in the field.

